E-commerce Website Speed Optimization: Every Second Costs You Sales

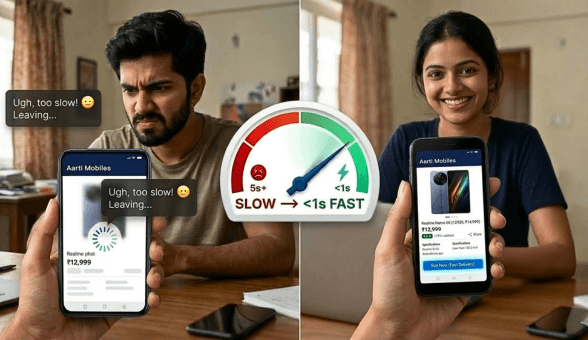
There is a number every Indian e-commerce seller should know by heart. A one-second delay in page load time reduces conversions by 7 percent. At first glance that sounds theoretical. Run the math against your actual monthly revenue and it stops being theoretical very quickly. If your store earns Rs. 5 lakhs a month and your product pages load in 4 seconds instead of 2, you are likely leaving Rs. 70,000 to Rs. 1 lakh on the table every single month, not from bad products, not from poor marketing, but from a slow website.
Mobile internet usage dominates Indian e-commerce. Over 72 percent of online purchases in India happen on smartphones, many of them on 4G connections in tier-2 and tier-3 cities where network conditions are inconsistent. A store that loads in 3 seconds on fibre in Chennai can take 7 to 9 seconds on a 4G connection in Coimbatore or Indore. Every extra second is a bounce, and every bounce is a lost sale.
This guide covers every practical speed optimization lever available to Indian online sellers, from image compression to CDN configuration to Core Web Vitals. Whether you are on a hosted platform like Boomimart or managing your own infrastructure, the principles apply.
Why Website Speed Is a Revenue Problem, Not a Technical Problem
Most sellers treat website speed as something the developer handles. That mental model is wrong and expensive. Speed is a business metric with direct revenue implications. Understanding it as such changes how urgently you prioritize it.
| Load Time | Estimated Conversion Impact | Business Context |
| Under 2 seconds | Baseline conversion rate | Optimal for Indian mobile users |
| 2 to 3 seconds | 7-10% conversion drop | Acceptable range, monitor closely |
| 3 to 5 seconds | 20-30% conversion drop | Significant revenue leakage begins |
| 5 to 7 seconds | 40-50% conversion drop | Most mobile visitors abandon |
| Above 7 seconds | 60-70% conversion drop | Effectively invisible to impatient users |
Speed also directly affects your Google rankings. Since the 2021 Page Experience update, Google uses Core Web Vitals as ranking signals. A slow store ranks lower in organic search, meaning your paid and organic traffic acquisition costs rise as your speed falls. Google’s own research on page speed and commerce consistently shows that speed improvements compound across both conversion rates and search visibility simultaneously.
Understanding Core Web Vitals: The Metrics That Actually Matter
Google measures page experience through three Core Web Vitals. These are not obscure developer metrics. They map directly to how a real customer experiences your store on a phone.
Largest Contentful Paint (LCP)
What it measures: How long it takes for the largest visible element on the page to fully load. For a product page, this is usually the main product image. For a homepage, it might be the hero banner.
Target: Under 2.5 seconds. Between 2.5 and 4 seconds needs improvement. Above 4 seconds is poor.
The most common LCP culprit on Indian e-commerce stores is unoptimized product images. A 3MB JPEG hero image will always produce a poor LCP score regardless of everything else you do.
First Input Delay (FID) / Interaction to Next Paint (INP)
What it measures: How quickly the page responds when a customer taps a button, opens a dropdown, or interacts with any element. Google has shifted from FID to INP (Interaction to Next Paint) as the primary interactivity metric as of March 2024.
Target: INP under 200 milliseconds is good. 200 to 500 milliseconds needs improvement. Above 500 milliseconds is poor.
Heavy JavaScript that blocks the browser thread is the primary cause of poor INP scores. This includes chat widgets, marketing scripts, and third-party review carousels that load synchronously on page load.
Cumulative Layout Shift (CLS)
What it measures: How much the page visually shifts while loading. When a customer tries to tap ‘Add to Cart’ and the button jumps because an image loaded late, that shift is measured as CLS.
Target: CLS score under 0.1 is good. 0.1 to 0.25 needs improvement. Above 0.25 is poor.
Images and ads without defined dimensions are the leading cause of layout shift on product pages. Always define width and height attributes on product images in your store template.
| Core Web Vital | What It Measures |
| LCP (Largest Contentful Paint) | Load speed of the main visible element |
| INP (Interaction to Next Paint) | Responsiveness to user taps and clicks |
| CLS (Cumulative Layout Shift) | Visual stability while page loads |
Step 1: Fix Your Images First
Images account for 50 to 80 percent of total page weight on a typical e-commerce product page. They are the single highest-impact optimization lever and require no development knowledge to address.
Resize Before You Upload
A product image displayed at 600 pixels wide does not need to be uploaded at 3,000 pixels wide. Yet the majority of Indian sellers upload camera phone photos or vendor-supplied images at full resolution. A 4,000 x 3,000 pixel JPEG at 5MB will be displayed at 600 x 450 pixels but every byte still has to download. Resize images to their display dimensions before uploading.
Convert to Modern Formats
WebP images are 25 to 35 percent smaller than equivalent JPEG files with no visible quality difference. AVIF is even more compressed but has slightly less browser support. For Indian e-commerce stores targeting broad device coverage, WebP is the practical standard in 2026. Most modern image editors and online converters handle JPEG to WebP conversion in seconds.
Compress Without Losing Quality
Even after resizing to correct dimensions, run every image through a lossy compression tool. A well-compressed WebP product image should be under 100KB for most standard use cases. Images above 300KB should be treated as a performance emergency on a mobile-first store.
Lazy Load Below-the-Fold Images
Images below the visible screen area do not need to load immediately. Lazy loading delays their download until the customer scrolls toward them. Most modern platforms support lazy loading natively. If yours does not, it is a significant technical gap worth addressing.
Is Your Store Losing Sales to Slow Load Times?
Step 2: Implement a Content Delivery Network (CDN)
A CDN stores copies of your store’s static assets, images, stylesheets, scripts, on servers distributed across multiple geographic locations. When a customer in Jaipur opens your store, the CDN serves images from a server in Delhi or Mumbai rather than from your hosting server in, say, Hyderabad. The distance the data travels drops by hundreds of kilometers and load time falls accordingly.
For Indian e-commerce stores, CDN coverage across major metros and tier-2 cities is the relevant benchmark. A CDN with nodes in Mumbai, Delhi, Chennai, Bengaluru, and Hyderabad covers the majority of Indian internet traffic with low latency.
| Without CDN | With CDN | Impact |
| All requests go to origin server | Requests served from nearest node | 40-60% faster static asset delivery |
| Single point of failure | Redundant nodes absorb traffic spikes | Better uptime during sale events |
| High server load during peak traffic | CDN absorbs static asset load | Origin server handles only dynamic requests |
| Same latency from all locations | Low latency from all Indian metros | Consistent experience nationwide |
Most managed e-commerce platforms include CDN functionality. If you are on Boomimart, static asset delivery through CDN is part of the infrastructure layer. If you are on a self-hosted platform, CDN configuration requires separate setup through a provider and is typically one of the highest ROI infrastructure investments you can make.
Step 3: Eliminate Render-Blocking Scripts
Every third-party script your store loads, live chat widgets, Facebook Pixel, Google Analytics, review carousels, retargeting pixels, adds to the time before the page becomes usable. Many of these scripts load synchronously, which means the browser stops rendering the page until each script has fully downloaded and executed.
The symptom is a page that shows a white screen for 2 to 3 seconds before anything appears. The customer experiences this as a blank, broken page and leaves before your content ever renders.
Audit Every Third-Party Script You Are Running
- Open your store in an incognito browser and use Chrome DevTools to list all network requests
- Identify every script that loads before the main content appears
- Categorize each as essential (cannot remove) or non-essential (marketing, analytics)
- Non-essential scripts should load asynchronously or be deferred until after the main content renders
The Script Load Order Principle
The rule is simple: nothing that is not required to display the page should block the page from displaying. Chat widgets, exit-intent popups, heatmap tools, and affiliate tracking pixels can all load after the product content is visible.
Step 4: Optimize Your Hosting Environment
The server that hosts your e-commerce store has a foundational impact on speed that no amount of front-end optimization can fully compensate for. Hosting decisions made two or three years ago based on cost may now be the primary bottleneck on your store’s performance.
Time to First Byte (TTFB)
TTFB measures how long the browser waits before receiving the first byte of data from your server. A TTFB above 600 milliseconds indicates a server-side performance problem. Causes include shared hosting overload, slow database queries, or geographic distance between server and customer.
Server Location Matters for Indian Stores
If your hosting server is located in Singapore or the US, every Indian customer pays a latency penalty for the physical distance the data must travel. Hosting on servers located within India, or using a CDN to compensate, is essential for competitive performance on Indian mobile connections.
Managed Hosting vs Self-Managed
Self-managed servers give you control but require active optimization of server software, caching configurations, and database performance. Managed hosting platforms handle these layers for you. The tradeoff is control versus operational simplicity. For most Indian SMBs where the business owner is not a server engineer, managed hosting is the more reliable path to consistent performance.
Step 5: Configure Aggressive Browser Caching
When a customer visits your store for the first time, their browser downloads all assets: images, stylesheets, fonts, scripts. On a second visit, a properly configured cache allows the browser to use locally stored copies of unchanged assets rather than downloading them again. This makes repeat visits dramatically faster and reduces server load.
| Asset Type | Recommended Cache Duration |
| Product images | 30 days minimum, ideally 1 year |
| CSS stylesheets | 7 to 30 days (version on update) |
| JavaScript files | 7 to 30 days (version on update) |
| Brand fonts | 1 year (rarely change) |
| Homepage HTML | 0 to 1 hour (frequently updated) |
| Product page HTML | 1 to 4 hours (price/stock changes) |
On managed platforms, cache headers are configured at the infrastructure level and applied automatically. On self-hosted stores, cache configuration requires explicit setup in your web server configuration or through a caching plugin. Incorrectly configured caching is a common cause of customers seeing outdated prices or stock information.
Step 6: Minimize and Compress Code Files
Every CSS stylesheet and JavaScript file your store loads contains human-readable formatting: indentation, comments, spaces between variable names. This makes code maintainable for developers but adds unnecessary bytes for browsers. Minification removes all formatting without changing functionality, typically reducing file sizes by 20 to 40 percent.
Gzip or Brotli compression takes this further by compressing text files before they are transmitted from server to browser. Brotli is more efficient than Gzip and is supported by all modern browsers. Enabling compression at the server level can reduce text asset transfer sizes by 60 to 80 percent.
Practical Actions for Indian Sellers
- Ask your hosting or platform provider whether Brotli or Gzip compression is enabled on your store
- Verify CSS and JavaScript files are minified in production (not in development)
- Remove unused CSS from your stylesheets, especially if you have customized a theme
- Combine multiple small CSS or JS files into fewer larger files to reduce HTTP request count
Is Your Store Losing Sales to Slow Load Times?
Step 7: Audit Your Product Page Architecture
Beyond technical optimizations, how your product pages are structured has a measurable impact on perceived and actual load speed. Pages with dozens of product recommendations, multiple embedded review widgets, live chat, exit-intent popups, and social sharing buttons are asking browsers to make tens of additional network requests and run thousands of lines of additional JavaScript before the core shopping experience appears.
Product Page Load Audit Checklist
- Number of HTTP requests: Under 50 is good. Over 80 needs investigation.
- Total page weight: Under 1.5MB for product pages. Under 2MB for image-heavy homepages.
- Above-the-fold load: Product name, price, and primary image should be visible within 1.5 seconds on 4G.
- Third-party request count: Each third-party domain adds DNS lookup time. More than 10 external domains is a concern.
- Font load strategy: Custom fonts should use font-display: swap to prevent invisible text during load.
Run your store through Google PageSpeed Insights, which is free and provides specific improvement recommendations, not just a score. The Opportunities and Diagnostics sections tell you exactly what to fix and quantify the potential improvement in seconds.
Mobile Speed: The Priority That Overrides Everything Else
Everything covered in this guide matters more on mobile than on desktop. Your desktop speed scores can be excellent while your mobile scores remain poor, and since over 70 percent of your customers are on mobile, the mobile score is the one that drives revenue.
Two additional mobile-specific optimizations deserve attention beyond the general techniques covered above.
Responsive Images with srcset
A desktop user viewing a product at 1200 pixels wide should receive a different image file than a mobile user viewing the same product at 390 pixels wide. The srcset attribute in HTML allows browsers to automatically request the correctly sized image for the screen. Most modern platforms handle this automatically, but if your theme uses fixed image URLs, you are serving desktop-sized images to every mobile visitor.
Reduce JavaScript Execution on Mobile
Mobile processors are significantly slower than desktop processors at executing JavaScript. A script that runs in 80 milliseconds on a laptop might take 400 milliseconds on a mid-range Android phone. Audit your JavaScript payloads specifically for mobile performance. Code splitting, which divides JavaScript into smaller bundles loaded only when needed, is the most effective technique for reducing mobile JS execution time.
| Optimization | Desktop Impact | Mobile Impact |
| Image compression | Moderate improvement | High improvement (bandwidth-constrained) |
| CDN deployment | Low to moderate | High (latency reduction on 4G) |
| Script deferral | Moderate | Very high (slow processors benefit most) |
| Browser caching | High for repeat visits | Very high (slower connections benefit more) |
| Responsive images | Low | High (avoids downloading oversized files) |
Measuring Speed Before and After Optimization
Optimization without measurement is guesswork. Before you make any changes, record your baseline metrics. After each change, measure again. This gives you evidence of what worked and helps you prioritize the highest-impact actions.
Tools to Use for Speed Measurement
- Google PageSpeed Insights: Free, measures both mobile and desktop, gives Core Web Vitals scores and specific recommendations.
- GTmetrix: Provides waterfall view of every asset load, useful for identifying specific slow elements.
- WebPageTest: Allows testing from specific locations including India-based test servers.
- Chrome DevTools Lighthouse: Built into Chrome browser, simulates throttled mobile connections for realistic Indian 4G testing.
Test your store from an Indian connection when possible. Speed scores measured from US or European test servers will be optimistic relative to your actual Indian customers’ experience. WebPageTest allows you to specify test locations and connection speeds, making it the most representative tool for Indian store owners.
Speed Optimization for Sale Events and Peak Traffic
Indian e-commerce sellers face concentrated traffic spikes during sale events, festival seasons, and flash sales. A store that performs adequately at normal traffic can buckle under 10x load if infrastructure is not prepared. Slow load times during a sale event are doubly damaging because customers are more ready to buy and more willing to switch to a competitor who loads faster.
Pre-Sale Optimization Checklist
- Run a full PageSpeed Insights audit at least two weeks before a major sale
- Compress and re-upload all sale landing page hero images
- Confirm CDN is configured and caching is aggressive on product pages
- Remove or disable any non-essential third-party scripts temporarily during the sale period
- Test checkout flow specifically on a throttled mobile connection before the sale goes live
- Confirm your hosting plan can handle the expected traffic spike without CPU throttling
Sellers scaling from high daily orders to sale-event spikes benefit from reviewing the infrastructure discussion in Boomimart’s scaling guide, which covers both operational and technical capacity planning.
Frequently Asked Questions
How do I check my store’s current speed score?
Go to Google PageSpeed Insights and enter your store URL. Run the test on Mobile view first since that reflects your primary customer base. Record the LCP, INP, and CLS scores. These are your baseline numbers before any optimization work begins.
Will speed optimization affect my product image quality?
Done correctly, no. WebP compression at quality levels of 80 to 85 percent produces images that are visually indistinguishable from uncompressed originals on mobile screens. The difference is only detectable on high-resolution desktop monitors at full zoom. For the product presentation context of a mobile e-commerce screen, optimized images look identical.
My store is on a hosted platform. How much can I control?
On a managed hosted platform, the infrastructure layer (server speed, CDN, compression, caching headers) is controlled by the platform. Your controllable levers are image optimization before upload, minimizing third-party script additions, and product page content architecture. Platforms like Boomimart handle the infrastructure performance layer, which means image optimization and script discipline are the primary levers you control directly.
How much speed improvement is realistic for an Indian e-commerce store?
Sellers who address image optimization, enable CDN, and remove unnecessary scripts consistently achieve 40 to 60 percent reductions in page load time. A store loading in 6 seconds can realistically reach 2.5 to 3 seconds through these changes alone. The corresponding conversion improvement varies, but a 15 to 25 percent uplift in conversion rate is a commonly reported outcome from comprehensive speed optimization.
Does website speed affect my Google Ads quality score?
Yes, indirectly. Google Ads landing page experience is a component of Quality Score, and a slow landing page that produces high bounce rates signals poor experience. Higher Quality Scores reduce your cost-per-click and improve ad position. Speed optimization thus affects both organic SEO and paid advertising efficiency simultaneously.
Should I prioritize homepage speed or product page speed?
Product pages. The majority of paid traffic and most organic search traffic lands directly on product pages, not on the homepage. Customers browsing from search results or product ads never see your homepage. Optimize product page LCP and mobile load time first. Homepage optimization matters for brand campaigns and repeat visitor experience, but product page speed has higher direct revenue impact.