Inventory Forecasting for Indian E-commerce: Avoiding Stockouts and Dead Stock

Two inventory problems quietly destroy Indian e-commerce businesses, and they sit at opposite ends of the same spectrum.
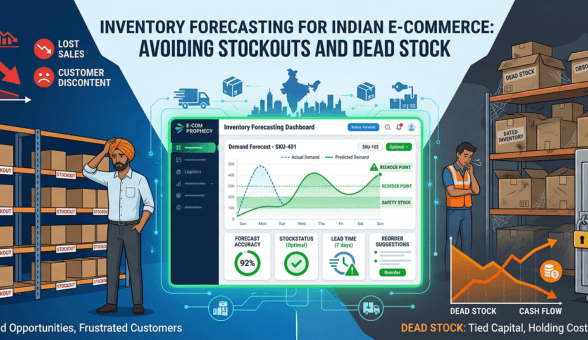
The first is the stockout: a product that sells well runs out, orders cannot be fulfilled, customers go elsewhere, and some of them never come back. During festive season spikes, a single stockout on a bestseller can wipe out weeks of marketing investment in 48 hours.
The second is dead stock: products that were ordered in optimistic quantities sit on shelves for months, locking up working capital that could be funding new stock, marketing, or operations. In a cash-flow-sensitive Indian SMB, dead stock is not just an efficiency problem, it is a survival risk.
Why Inventory Forecasting is Harder in India Than Most Markets
Standard inventory forecasting models are built for markets with predictable, relatively smooth demand curves. The Indian e-commerce market has several characteristics that make forecasting more complex and make the cost of getting it wrong significantly higher.
Festive Season Demand Spikes Are Extreme
Indian e-commerce demand does not grow gradually. It spikes violently around Diwali, Navratri, Pongal, Eid, Onam, Raksha Bandhan, and regional festivals that vary by geography. A product that sells 200 units in a regular October week might sell 1,800 units in the week before Diwali. Sellers who forecast based on regular weekly averages arrive at the festive season underprepared and lose revenue they cannot recover.
COD Returns Create Inventory Uncertainty
In most international markets, a product dispatched is a product sold. In India, COD returns mean a dispatched product may come back 7 to 14 days later. Return rates for COD orders in categories like fashion, footwear, and lifestyle products can run between 20 and 40 percent. Inventory planning that does not account for return velocity will consistently overstate available stock and trigger premature reorders.
Supplier Lead Times Are Inconsistent
Indian supply chains, particularly for small and mid-size sellers sourcing from domestic manufacturers, handicraft clusters, or agricultural producers, are subject to significant lead time variability. A supplier who normally delivers in 7 days may take 18 days during harvest season, before Diwali when their own production is stretched, or due to transport disruptions. Forecasting models that assume fixed lead times fail when lead times vary by 50 to 100 percent.
Managing Inventory Across Multiple Channels?
The Core Concepts of Inventory Forecasting
Before building a forecasting system, it helps to understand the four numbers that drive every inventory decision. These are not complicated, but sellers who skip them consistently end up managing inventory reactively rather than proactively.
1. Average Daily Sales (ADS)
The starting point for every forecast. Calculate this by dividing total units sold in a period by the number of days in that period. For products with strong seasonality, calculate separate ADS figures for peak periods and off-peak periods rather than using a single annual average that misrepresents both.
For a product that sold 420 units over the last 30 days: ADS = 420 / 30 = 14 units per day.
2. Lead Time
The number of days between placing a purchase order with your supplier and having the stock available in your warehouse, ready to fulfil customer orders. Measure your actual lead times over several order cycles rather than using your supplier’s stated lead time, which is often optimistic. Track both your average lead time and your maximum lead time, as both are used in safety stock calculations.
3. Reorder Point (ROP)
The stock level at which you need to place a new purchase order to avoid running out before the new stock arrives. The reorder point accounts for both your daily sales rate and your supplier lead time.
For a product with ADS of 14 units, average lead time of 7 days, and safety stock of 42 units: ROP = (14 x 7) + 42 = 98 + 42 = 140 units. When your stock drops to 140 units, place the next purchase order.
4. Safety Stock
The buffer inventory held above the expected demand during lead time to protect against demand spikes and supplier delays. Safety stock is the difference between smooth operations and chronic stockouts for sellers in markets with demand variability.
For a product where maximum daily sales hit 22 units (vs average 14), maximum lead time reaches 12 days (vs average 7): Safety Stock = (22 x 12) minus (14 x 7) = 264 minus 98 = 166 units.
| Forecasting Term | What It Means | Why It Matters |
| Average Daily Sales | Units sold per day on average | Foundation of all reorder calculations |
| Lead Time | Days from PO to stock available | Determines how early to reorder |
| Reorder Point | Stock level that triggers a new order | Prevents stockouts during supplier lead time |
| Safety Stock | Buffer above expected demand | Protects against demand spikes and delays |
Building a Seasonal Demand Forecast for Indian E-commerce
The standard forecasting models that work in flat-demand markets need to be adapted for the extreme seasonality of the Indian e-commerce calendar. Here is a practical approach that works for sellers without access to sophisticated forecasting software.
Step 1: Map Your Demand Calendar
Start by plotting your monthly sales for the last 12 months against the Indian festive and commercial calendar. Identify which months or weeks show demand spikes and by what multiple relative to your baseline. Common demand multipliers for Indian e-commerce categories:
- Fashion and apparel: 3x to 6x during Navratri, Diwali, Eid, and wedding season months
- Home decor and gifting: 4x to 8x in the two weeks before Diwali
- Food and grocery specialty items: 2x to 4x during Pongal, Onam, Diwali, and Eid
- Electronics and gadgets: 3x to 5x during major sale events and Diwali
- Personal care and wellness: 1.5x to 2.5x during New Year and Valentine’s season
Step 2: Calculate Category-Specific Seasonal Multipliers
Once you have 12 months of sales data, calculate a seasonal index for each month by dividing that month’s actual sales by your monthly average. A month with a seasonal index of 2.4 means demand in that month is typically 2.4 times your average monthly demand. Apply this index to your current average when forecasting future months.
Step 3: Set Your Pre-Season Reorder Dates
For festive season stock, a single reorder that arrives just before the festival is not a reliable strategy. Supplier capacity constraints mean that every Indian seller is placing large festive orders at the same time, which extends lead times. Build a pre-season stocking plan with at least two ordering rounds: a base order placed 8 to 10 weeks before the peak period, and a top-up order placed 3 to 4 weeks before the peak based on how early demand is tracking.
Forecasting Methods: From Simple to Systematic
Not every Indian e-commerce seller needs a sophisticated forecasting model on day one. The right method depends on your business size, data availability, and the complexity of your product catalog. Here are three approaches in order of increasing sophistication.
Method 1: Moving Average (For Early-Stage Sellers)
A simple moving average uses the average of your last N weeks or months of sales to project the next period. A 4-week moving average adds up the last 4 weeks of sales and divides by 4 to get the projected weekly demand for the next period.
Method 2: Weighted Moving Average With Seasonal Adjustment (For Growing Sellers)
A weighted moving average gives more importance to recent sales periods than older ones, which is more appropriate for products whose demand is trending up or down. The most recent week’s sales might get a weight of 40 percent, the week before 30 percent, the week before that 20 percent, and the oldest week 10 percent.
Apply a seasonal multiplier on top of this weighted average to account for known demand spikes. This is the method that most Indian e-commerce sellers with 6 to 12 months of data should be using.
Method 3: Demand Planning With Statistical Safety Stock (For Scale Sellers)
At higher order volumes and larger SKU counts, a more systematic approach calculates demand forecasts using statistical methods that account for demand variability (measured as standard deviation of daily sales) and desired service level (the percentage of orders you want to be able to fulfil from stock without delay).
Where Z-score corresponds to your target service level: 1.65 for 95 percent service level, 1.96 for 97.5 percent, 2.33 for 99 percent.
| Method | Suitable For | Data Needed |
| Simple Moving Average | Under 50 SKUs, stable demand | 4 to 8 weeks of sales history |
| Weighted Moving Average + Seasonal Adjustment | 50 to 500 SKUs, seasonal business | 6 to 12 months of sales history |
| Statistical Safety Stock Model | 500+ SKUs, scale operations | 12+ months with demand variability data |
Managing Inventory Across Multiple Channels?
Managing Dead Stock: Identifying It, Reducing It, Recovering From It
Dead stock is inventory that has not moved in 60 to 90 days. It is not just a storage inconvenience. It represents cash that is physically sitting on a shelf instead of being invested in marketing, new products, or operations.
How Dead Stock Accumulates
Dead stock is almost always the result of one of four situations:
- Overbuying based on optimism: A new product or seasonal item was ordered in large quantities based on expected demand that did not materialise
- Trend mismatch: A product bought when a trend was rising arrived after the trend peaked and demand had already shifted
- Variant imbalance: The correct total quantity was ordered but the wrong size or colour breakdown, leaving some variants with full stock and others with zero
- Damage or quality issues: A portion of stock was received damaged or falls below quality standards after storage, making it unsellable at full price
How to Identify Dead Stock Early
Do not wait 90 days to identify a dead stock problem. Set a 30-day review trigger: any SKU that has sold zero units in 30 days while stock is available should be flagged for review. At 45 days with no movement, it should be escalated to a decision about pricing or disposal action.
Dead Stock Recovery Options
When dead stock is identified, there are four practical recovery paths for Indian e-commerce sellers:
- Flash sale or clearance: A time-limited discount event that creates urgency. Works best for fashion, lifestyle, and seasonal products where buyers perceive value in the discount. The margin sacrifice is offset by freeing up working capital and storage space.
- Product bundling: Package the slow-moving item with a fast-moving one at a combined price that makes the bundle attractive. The fast-moving product creates the pull; the slow-moving one clears without being discounted individually. The approach to bundling is covered in detail in the guide on product bundling strategy for e-commerce.
- B2B or bulk clearance: Offer the stock to small retailers, gift companies, or corporate gifting buyers at a wholesale price. This recovers more value than deep discounting to retail customers, though it requires finding the right buyers.
- Donation and write-off: For stock that cannot be sold at any reasonable price, donating to NGOs or community organisations provides a tax benefit and removes the stock from the balance sheet. This is preferable to continuing to pay for storage of unsellable inventory.
The Indian Supplier Relationship and Its Impact on Forecasting
In Western e-commerce markets, suppliers are often large manufacturers with predictable production schedules and precise lead time commitments. In Indian e-commerce, particularly for sellers sourcing from artisan clusters, small-batch manufacturers, agricultural producers, or regional suppliers, the relationship dynamic is different and it directly affects how you should build your forecasting buffers.
Build Lead Time Data From Your Own Order History
Do not rely on supplier-stated lead times for your reorder point calculations. Track the actual number of days between each purchase order date and the date stock arrives ready to fulfil for the last 6 to 12 order cycles with each supplier. The average and maximum of these actual figures are your planning inputs.
Maintain a Supplier Risk Rating
Some suppliers are consistently on time. Others are frequently delayed. Maintain a simple rating based on on-time delivery percentage over your last 10 orders with each supplier. Suppliers with an on-time rate below 70 percent should have wider safety stock buffers than reliable suppliers, regardless of what their stated lead times are.
Communicate Demand Signals Upstream
For sellers with established supplier relationships, sharing early demand signals helps suppliers plan their own production. If your festive season data shows you will need 3x your regular order quantity in October, giving your supplier that signal in August rather than September gives them enough time to source materials and schedule production. This is one of the highest-value practices for sellers whose business is big enough to move their supplier’s planning cycle.
Using Inventory Automation to Reduce Forecasting Errors
Manual inventory forecasting, even when the formulas are correct, is only as accurate as the data being fed into it. If stock counts are not updated in real time, if returns are not logged promptly, or if transfers between storage locations are not recorded immediately, the forecast inputs are wrong before the calculation even begins.
Automated Low-Stock Alerts
Setting reorder points within your inventory system and triggering automatic alerts when stock crosses those thresholds removes the human memory dependency from the reorder process. You do not need to remember to check stock levels for 200 SKUs every Monday morning. The system tells you when action is needed.
Purchase Order Tracking
| Automation Feature | Problem It Solves |
| Real-Time Stock Sync | Forecast inputs based on stale or manually updated data |
| Automated Reorder Alerts | Stockouts caused by forgetting to check or reorder in time |
| Purchase Order Tracking | Duplicate orders when reorder triggers fire on in-transit stock |
| Return Stock Reconciliation | Phantom inventory from COD returns not logged to available stock |
Managing Inventory Across Multiple Channels?
Forecasting for New Products With No Sales History
Every product was new at some point. Forecasting demand for a product with no sales history is genuinely difficult, but there are structured approaches that are more reliable than pure intuition.
Use Analogous Product Data
If you have previously launched products in the same category or at a similar price point, their launch period sales data provides a reasonable proxy for your new product forecast. Adjust up or down based on differences in your current audience size, marketing investment, and any market signals you have from pre-launch interest.
Pre-Launch Demand Signals
Pre-launch activities like waitlists, early access sign-ups, social media engagement on product teasers, and WhatsApp broadcast responses give demand signals before you commit to stock. A waitlist of 400 genuine subscribers for a product you plan to sell at Rs 1,200 with an assumed 25 percent conversion rate suggests approximately 100 units of initial demand. This is a starting point, not a guarantee, but it is more grounded than a guess.
Start Lean and Reorder Fast
For genuinely new products with no analogous data and limited pre-launch signals, the most risk-appropriate strategy is to launch with a conservative initial stock quantity, watch sell-through velocity for the first two to three weeks, and reorder based on what you observe. The cost of a small early stockout on a new product is lower than the cost of holding months of dead stock if the product does not find its audience. As your supplier relationship matures and your lead times are reliable, you can tighten this cycle.
Building a Monthly Inventory Review Cadence
Forecasting is not a one-time activity. It is a monthly discipline that gets more accurate over time as you accumulate better data and refine your seasonal multipliers. A practical monthly inventory review covers:
- Sell-through rate by SKU: What percentage of available stock sold in the period? A sell-through rate below 20 percent in a normal month flags a potential dead stock risk.
- Stockout events: How many times did a product hit zero and create an unfulfillable order? Each stockout event is a revenue loss and a customer trust loss that should be tracked and addressed.
- Reorder accuracy: Were your reorder quantities right, or did you run out before the next order arrived? Were there products where the new order arrived before the old stock was even close to finished?
- Seasonal index update: Add the latest month’s data to your seasonal model and recalculate multipliers annually.
- Supplier performance review: Which suppliers delivered on time and which did not? Adjust safety stock buffers for underperforming suppliers.
Turning Forecasting Into a Competitive Advantage
Most Indian e-commerce sellers manage inventory reactively. They reorder when stock gets low, scramble to source during festive peaks, and discover dead stock problems only when their accountant asks why working capital is tied up. This is the status quo, which means that sellers who forecast proactively operate with a meaningful operational advantage over their peer group.
A seller who enters Diwali with the right stock quantities, has pre-negotiated supplier capacity for peak production, and has set automated reorder points that prevent mid-season stockouts will outperform a similarly-sized competitor who enters the same period under-stocked or carrying excess of the wrong SKUs. The revenue difference in that festive window can be the difference between a good year and a great one.